Monitoring Kaunas air quality – data directly to the screens of computers and smart devices
Paskelbta: 2022-08-08 (Monday)
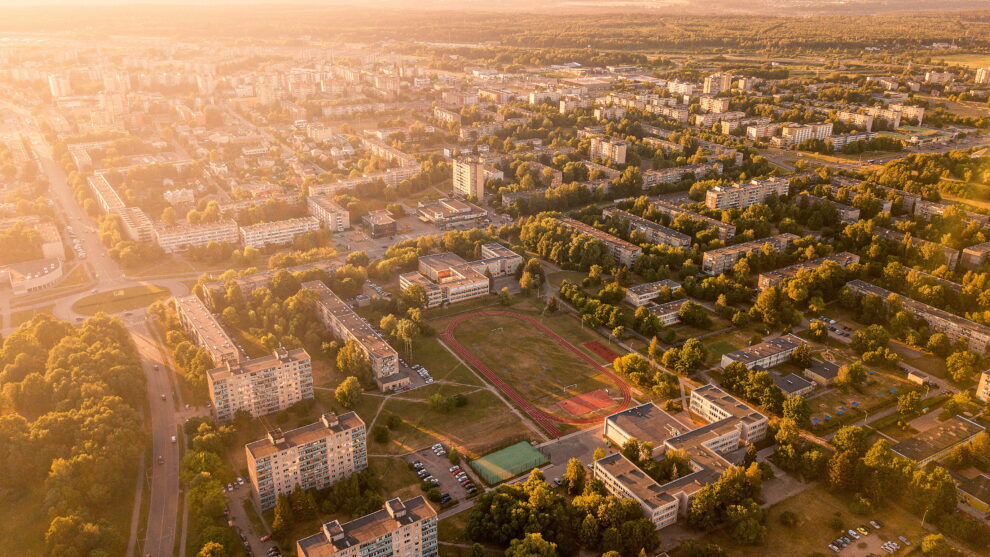
From now on, Kaunas residents can familiarize themselves with information about air pollution in their neighborhood (office). Data from two dozen sensors are presented on a specially created platform orotarsa.kaunas.lt. The interactive map records concentration levels of the main pollutants: solid particles, carbon monoxide, ground level ozone, nitrogen and sulfur dioxide, as well as the Air Pollution Level Index (OUI), which allows people to evaluate the potential health risks.
“Until 2021, data on air pollution came from only one station in Petrašiūnai. This was far from reflecting the real situation; therefore, we decided to assess the air quality in all parts of Kaunas.
By seeing all the data, specialists can solve long-term and short-term problems of pollution sources, and residents can get information about local air quality, which can have a direct impact on their health,” – said Tadas Metelionis, director of Kaunas City Municipality Administration.
In Kaunas, measurements of air pollution are constantly carried out in 20 different places, located in all 11-neighborhood offices. Data from autonomously functioning measuring devices are presented on the map (at orotarsa.kaunas.lt) based on geoinformation technology systems (GIS).
It captures average levels of the main pollutants that may be harmful to health and environment. These are solid particles (KD2.5 and KD10), carbon monoxide (CO), ground ozone (O3), nitrogen (NO2) and sulfur dioxides (SO2).
“While creating the platform, we try not to overload it with excess information. We present a simplified version of it to the citizens of Kaunas. Platform consists of maps, data tables, comparisons of indicators and a description of air pollutants.
Specialists receive significantly more extensive data – the concentration of all measured pollutants in the air, wind directions, humidity and temperature are recorded every hour. This allows us to see the entirety of pollutants emitted into the environment and draw conclusions in order to take appropriate actions”, – said Radeta Savickienė, head of the Environmental Protection Department of Kaunas City Municipality Administration.
According to her, residents can monitor information, which is updated twice a day, on the platform. Daytime pollution is announced at 14:30 and nighttime at 04:00.
On the maps, the results from air sensors are presented visually – in colored scales. Green means zero or little, yellow means moderate and red means heavy pollution.
Those who wish to analyze and compare data from different locations more closely can do so by selecting a table, a graph of indicators or a map of each pollutant on the platform. They indicate norms according to the international Air Pollution Level Index, which defines air quality standards.
Public Relations information


Contacts
Kaunas City Municipal administration,
Municipal budgetary institution,
Laisvės al. 96, LT-44251 Kaunas
Data is kept and stored at Registry of Legal Entities
Code 188764867
VAT payer‘s code LT 887648610
2017 m. Kaunas City Municipal. It is forbidden to copy and distribute the information available at www.en.kaunas.lt without permission of the authors.